🩷 방문자 추이
🏆 인기글 순위
티스토리 뷰
자바에서 geotools 라이브러리를 사용하여 히트맵 이미지를 만드는 방법입니다.
geotools에는 히트맵을 만드는 프로세스가 있으나 어떻게 개발하는지에 대해서는 여러 문서를 찾아봐야 했습니다.
진짜 이것저것 다 해보고 여러 오류들도 만나보고....여러 스트레스들도 찾아오고..
거진 일주일 정도 이것만 개발한 것 같아요.
어쨌든 히트맵 WMS API를 만드는데 성공하여 이렇게 기록을 남기게 되었죠!!
아래 링크에는 히트맵 개발에 필요한 HeatMapProcess.java와 HeatMapSurface.java 파일이 들어있습니다.
GitHub - geotools/geotools: Official GeoTools repository
Official GeoTools repository. Contribute to geotools/geotools development by creating an account on GitHub.
github.com
geotools의 HeatmapProcess를 사용하는 geoServer가 있기 때문에
구글링할 때 geoServer 키워드도 무지하게 검색했습니다😭
일단 heatMapProcessTest.java 파일을 보고
내 프로젝트에 필요한 파일들만 추려서 삽입했습니다
히트맵에 필요한 필수파일들은 6가지 입니다 (6개파일 모두 위의 링크에서 다운받을 수 있음)

그 다음 heatMapProcessTest.java의 코드와 동일하게 복붙하고, 파라미터를 수정했습니다
저는 좌표별 벨류값을 따로 가지고 있어서, 좌표데이터(fc) 아래에 value 파라미터를 추가해줬어요.
HeatmapProcess의 extractPoints메소드에서 xy 좌표값과 value 값으로 히트맵 포인트를 찍게 했습니다.
extractPoints에서 히트맵 포인트를 찍는 부분은 HeatmapSurface의 addPoint 요 부분입니다.
    public void addPoint(double x, double y, double value) {
        /** Input points are converted to grid space, and offset by the grid expansion offset */
        int gi = gridTrans.i(x) + kernelRadiusGrid;
        int gj = gridTrans.j(y) + kernelRadiusGrid;

        // check if point falls outside grid - skip it if so
        if (gi < 0 || gi > grid.length || gj < 0 || gj > grid[0].length) return;

        grid[gi][gj] += value;
    }
이렇게 GridCoverage2D를 만들고 나서 GeoTiffWriter를 이용해 tif파일로 저장해서 열어봅니다.
		int width = 1920;
		int height = 1080;
		SimpleFeatureCollection fc = createPoints(xy, bounds); //좌표들을 포인트로 찍어 넣음
		ProgressListener monitor = null;
		HeatmapProcess process = new HeatmapProcess();
		GridCoverage2D cov = process.execute(
                        fc, // 좌표데이터 (obsFeatures)
                        value,
                        50, // 히트맵 원 크기 (argRadiusPixels)
                        null, // weightAttr (valueAttr) 데이터 포인트 가중치에 사용할 속성의 이름. min=0, max=1
                        1, // pixelsPerCell (argPixelsPerCell) "열지도를 계산할 해상도(픽셀)입니다. 기본값 = 1",
                        bounds, // outputEnv
                        width, // outputWidth
                        height, // outputHeight
                        monitor // monitor)
                        );
x, y 좌표와 value 값으로 히트맵 데이터들이 잘 찍히기 했지만
읭? 색깔이 없습니다...!!!!ㅠㅠ
그리고 너무 흐릿흐릿해서 잘 보이지두 않구요

이것을 해결하기 위해서는 SLD로 히트맵 스타일을 만들어줘야 합니다 !!!
SLD XML 파일을 통해 히트맵 색도 원하는 대로 지정해줄 수 있습니다.
히트맵 컬러는 geoserver 설명서를 참고했습니다.
https://docs.geoserver.org/latest/en/user/styling/sld/extensions/rendering-transform.html
Rendering Transformations — GeoServer 2.21.x User Manual
Rendering Transformations Rendering Transformations allow processing to be carried out on datasets within the GeoServer rendering pipeline. A typical transformation computes a derived or aggregated result from the input data, allowing various useful visual
docs.geoserver.org
geoserver에서 사용된 이 히트맵 컬러!!!
너무예쁜거에요.

친절하게 sld xml 코드까지 잘 나와있습니다.
이미 코드상에서 파라미터들을 다 설정해줬기 때문에,
sld xml 파일에서 파라미터 설정부분은 다 날려버리고, RasterSymbolizer 부분만 복붙해서 가져옵니다.

ColorMapEntry를 최소값부터 최대값까지 설정하고싶은 컬러로 작성하여 주면 됩니다 !!
그리고 값이 0일때는 opacity를 0으로 두어서 투명하게 보이도록 합니다.
파일명은 heatmap.sld.xml 로 저장!!
<?xml version="1.0" encoding="ISO-8859-1"?>
<StyledLayerDescriptor version="1.0.0"
    xsi:schemaLocation="http://www.opengis.net/sld StyledLayerDescriptor.xsd"
    xmlns="http://www.opengis.net/sld"
    xmlns:ogc="http://www.opengis.net/ogc"
    xmlns:xlink="http://www.w3.org/1999/xlink"
    xmlns:xsi="http://www.w3.org/2001/XMLSchema-instance">
  <NamedLayer>
    <Name>Two color gradient</Name>
    <UserStyle>
      <Title>SLD Cook Book: Two color gradient</Title>
      <FeatureTypeStyle>
        <Rule>
          <RasterSymbolizer>
            <ColorMap>
              <ColorMapEntry color="#FFFFFF" quantity="0" opacity="0"/>
                 <ColorMapEntry color="#FFFFFF" quantity="0.02" opacity="1"/>
                 <ColorMapEntry color="#4444FF" quantity=".1" opacity="1"/>
                 <ColorMapEntry color="#FF0000" quantity=".5" opacity="1"/>
                 <ColorMapEntry color="#FFFF00" quantity="1.0" opacity="1"/>
            </ColorMap>
          </RasterSymbolizer>
        </Rule>
      </FeatureTypeStyle>
    </UserStyle>
  </NamedLayer>
</StyledLayerDescriptor>
mapcontent를 하나 생성하고,
지정할 스타일과 함께 GridCoverage2D를 mapcontent에 레이어로 추가해주면 끝!!!!
		MapContent map = new MapContent();

		File sld = new File("src/main/resources/static/xml/heatmap.sld.xml");
		Style styles = createFromSLD(sld);
		GridCoverageLayer layer = new GridCoverageLayer(cov, styles);
		map.addLayer(layer);
그다음은 히트맵 레이어를 추가한 지도 mapcontent를 이미지로 만들어주어 결과를 확인해봅니다.
아주 친절하게 geotools 가이드에 코드가 있습니다.
이미지뿐만 아니라 PDF, SVG 등등 다양하게 변환이 가능하네요.
https://docs.geotools.org/stable/userguide/library/render/gtrenderer.html
GTRenderer to draw maps — GeoTools 27-SNAPSHOT User Guide
GTRenderer to draw maps GTRenderer renderer is the reason why you signed up for this whole GeoTools experience; you want to see a Map. GTRenderer is actually an interface; currently there are two implementations: StreamingRenderer - a great implementation
docs.geotools.org
어쨌든 저는 WMS를 만들 것이므로 이미지 변환 코드를 복붙해왔습니다.
아주좋아요
public void saveImage(final MapContent map, final String file, final int imageWidth) {

    GTRenderer renderer = new StreamingRenderer();
    renderer.setMapContent(map);

    Rectangle imageBounds = null;
    ReferencedEnvelope mapBounds = null;
    try {
        mapBounds = map.getMaxBounds();
        double heightToWidth = mapBounds.getSpan(1) / mapBounds.getSpan(0);
        imageBounds = new Rectangle(
                0, 0, imageWidth, (int) Math.round(imageWidth * heightToWidth));

    } catch (Exception e) {
        // failed to access map layers
        throw new RuntimeException(e);
    }

    BufferedImage image = new BufferedImage(imageBounds.width, imageBounds.height, BufferedImage.TYPE_INT_RGB);

    Graphics2D gr = image.createGraphics();
    gr.setPaint(Color.WHITE);
    gr.fill(imageBounds);

    try {
        renderer.paint(gr, imageBounds, mapBounds);
        File fileToSave = new File(file);
        ImageIO.write(image, "jpeg", fileToSave);

    } catch (IOException e) {
        throw new RuntimeException(e);
    }
}
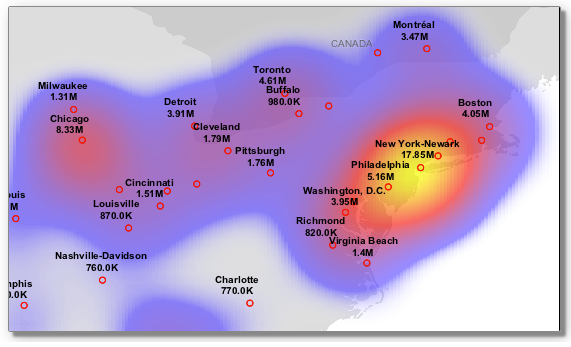
이미지를 저장해보니 아주 예쁘게 히트맵이 잘 나왔어요.
HttpServletResponse response로 WMS 이미지를 보내주면 끝!!!!
		response.setContentType("image/png");
		ServletOutputStream out = response.getOutputStream();
		WMSRequest wmsRequest = new WMSRequest();
		wmsRequest.getGetMap();

		ImageIO.write(image, "png", out);
WMS API가 완성되었어요.
원하는 파라미터를 넣어 다양하게 히트맵 WMS를 출력해줄 수 있게 되었습니다.

끝입니다!
'프로그래밍 > Java' 카테고리의 다른 글
| [spring] spring web project에 mongoDB 연동하기 (0) | 2022.05.16 |
|---|---|
| [java] 자바에서 이미지 배경색 투명으로 만드는 방법 (1) | 2022.04.05 |
| [java] Unexpected character ('<' (code 60)) 오류해결 (0) | 2022.03.22 |
| [java] 이미지 자르기 및 오류해결 BufferedImage.getSubimage (0) | 2022.03.16 |
| [오류해결] 스프링부트 jar파일 실행 시 build path 에러 (0) | 2021.10.28 |
